CheeseFrog
Forum Enthusiast
So should sharpening be done in the Raw tab first and fine tuned in RGB? I've been doing all my sharpening in the RGB tab.
Follow along with the video below to see how to install our site as a web app on your home screen.
Note: This feature may not be available in some browsers.
by staying away from RAW sharpening. Keep using the RGB sharpening. Personally, I import it into photoshop for the finishing touches.So should sharpening be done in the Raw tab first and fine tuned in RGB? I've been doing all my sharpening in the RGB tab.
")
--DPP video-tutorial (takes some time but is very informative):
http://www.video.bhphotovideo.com/?fr_story=6705482e45f83bfb581744e6bbf1bee3836e657f&rf=sitemap

I don't know why the speaker says that. He warns that "this (RAW) curve does not work like the RGB-tab curve or Photoshop curves" and he is right on that. But I think I understood how it works. My thoughts:One comment/question: in the video link below the speaker emphasizes not to adjust the left/right/top/bottom edges of the raw histogram in the raw tab. No explanation is given. Any thoughts?
JR
DPP video-tutorial (takes some time but is very informative):
http://www.video.bhphotovideo.com/?fr_story=6705482e45f83bfb581744e6bbf1bee3836e657f&rf=sitemap
I think the camera histogram is based on the RGB data with white point etc applied.Additional remark on "Fig1 x Fig3" (RAW histogram x camera's luminance histogram): the camera's histogram is actually the RAW histogram after the RAW tonal curve and clipped to the range between -2,5 and +2,5.
Regards, Anonimo
Yes, this is what I wrote on my post "About the camera's histogram" (the camera histogram is based on the RGB data, generated using the selected picture-style). I am complementing that answer because the original question was about the relationship between camera-histogram and the RAW-histogram (Fig 3 x Fig 1).I think the camera histogram is based on the RGB data with white point etc applied.Additional remark on "Fig1 x Fig3" (RAW histogram x camera's luminance histogram): the camera's histogram is actually the RAW histogram after the RAW tonal curve and clipped to the range between -2,5 and +2,5.
In the linked tutorial:
http://www.video.bhphotovideo.com/...b581744e6bbf1bee3836e657f&rf=sitemap he is talking about the power of the luminance adjustment with the histogram. I canot find the the Luminance button in DPP 3.8. It only has RGB, which means R G and B color combined -- very different from what he was talking about. Does anybody notice that?
--
Robert
--The recommendation is to make most adjustments in the RAW-tab and use the RGB-tab for fine-tuning. Following lines reproduce my understanding of how it works.
The histogram in the RAW-tab (your Fig.1 and Fig.4) represents the distribution of the pixel's luminance after demosaicing, still in the 14 bits space, before gamma compression / tonal curve. The horizontal scale is in light-stops, with "zero" representing the 18% gray. The RAW-data is encoded linearly with respect to the light intensity and the 14-bits format allows the record of 14 stops - that's why the scale goes from -10 to +4. For some reason the actual range is from -9 to slightly less than +4 though (maybe this is the widest range that can be converted to RGB).
There is a curve superposed to the histogram. This curve represents the tonal curve (gamma compression) to be applied to the RAW-luminance in the RGB conversion. The curve shares the same horizontal scale as the histogram; the vertical scale is linear and matches the horizontal scale of the histogram in the RGB-tab. Basically: this curve is applied to the RAW-luminance histrogram to generate the RGB-luminance histogram in the RGB-tab.
Notes:
- Changing the white balance impacts in the histogram because this correction is applied to the RAW-data before demosaicing. This is normaly the first adjustment that you should make in this tab.
- Moving the "Brightness adjustment" slider shifts the histogram accordingly; the tonal curve remains unchanged. This slider should be named "Exposure adjustment" instead.
- Contrast / highlights / shadows sliders and the linear-box act in the tonal curve. If you check the "linear" box the curve gets an exponential form (this is because the horizontal stops-scale is logarithmic with respect to the RAW-data).
- Color tone and saturation sliders also apply to the RGB-conversion (just like contrast/highlights/shadows sliders and the tonal curve itself) but act in the chrominance information. Because chrominance is orthogonal to luminance you will see no change in the tonal curve when moving these sliders. Same applies when you change the "Work color space" (sRGB, Adobe-RGB) in the "Adjustment" menu.
Contrast is related with the slope of the tonal curve (higher slope = more contrast, lower slope = less contrast). An alternative way to increase contrast in the RAW-tab is to shift the left-right borders of curve closer to center (just drag them in the diagram). This will squeeze the tonal curve in a narrower horizontal range, resulting higher slope / more contrast. When doing so, pay attention to the histogram (avoid clipping highlights; clipping shadows a bit less of a problem). In the other turn: an alternative way to reduce contrast in the RAW-tab is to move the lower/upper borders of the curve up/down (again, just drag them in the diagram).
- Changing the picture-style has no impact in the histogram but changes tonal curve, colour tone and saturation (that's what picture-styles are about). "Standard", "Portrait" and "Landscape" emulate the response of some popular film emulsions; "Faithful" emulates the human-eye response; "Neutral" preserves the most information for further RGB-tuning (recommended for JPG-shooters) and "Monochrome" is self-explaining.
Regards, Anonimo
Hello, loooooooooooooooooooots of questions

I. Tone curve/Histogram questions
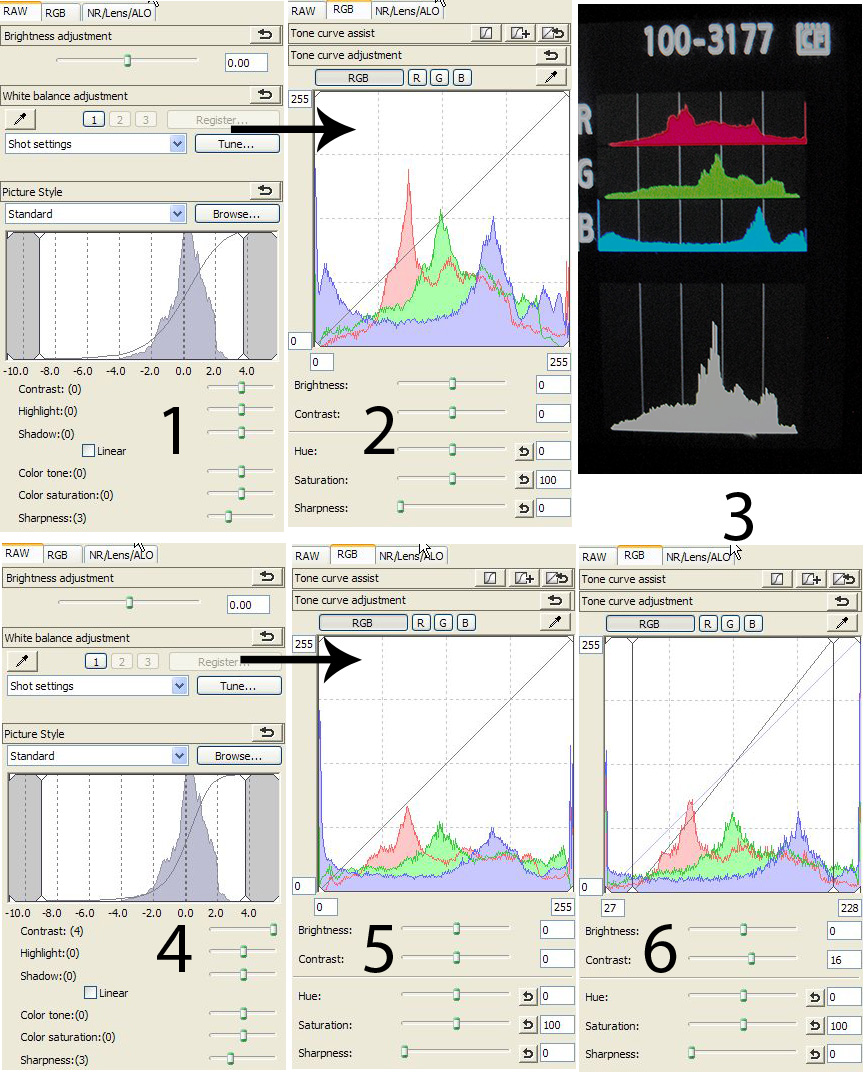
1) What does the the Diagram in Fig 1 mean, why is there a scale form roughly -9 to +3.9? Do these values habe a meaning? This is not a normal tone curve with values from 0 to 255 or a histogram with 5 apertures.
2) What does the 0 (bold dashed line) mean in Fig 1?
3) What does the S-curve mean, normally there should be a diagonal line like in (Fig when you don't change anything.
4) What is the difference/relation between Fig 1 diagram and Fig 3 bottom diagram(I didn't modify any settings).
II. Contrast settings questions
1) Contrast settings under the raw tab modifiy the tone curve (highlights and shadows) (Fig 4)
Contrast settings under the RGB tab cut some shadows and highlights (Fig 6).
Modifing contrast under RGB (Fig 6) and RAW (Fig 4) has a different effect......?????
III. Basic Questions
1) Fig 3 shows the histogram of my 5d II. I know the five line represents the 5 apertures (dynamic range). The tone curve has only four lines : 1 for shadows 2 for midtones an one for highlights? ...correct?
Kind regards
Gerard
Histogram of the data in the RAW file. The numbers are EV.I. Tone curve/Histogram questions
1) What does the the Diagram in Fig 1 mean, why is there a scale form roughly -9 to +3.9? Do these values habe a meaning? This is not a normal tone curve with values from 0 to 255 or a histogram with 5 apertures.
This shows the target exposition.2) What does the 0 (bold dashed line) mean in Fig 1?
It is normally an S curve. This is your tonal curve.3) What does the S-curve mean, normally there should be a diagonal line like in (Fig when you don't change anything.
fig 1: histogram of the RAW information.4) What is the difference/relation between Fig 1 diagram and Fig 3 bottom diagram(I didn't modify any settings).
When working in RAW you define how the data of the image is to be "developed" (so those modifications are before the image is developed).II. Contrast settings questions
1) Contrast settings under the raw tab modifiy the tone curve (highlights and shadows) (Fig 4)
Contrast settings under the RGB tab cut some shadows and highlights (Fig 6).
Modifing contrast under RGB (Fig 6) and RAW (Fig 4) has a different effect......?????
Those are basic questions about photography, so should not be "explained" in the software manual. Read a bit more about RAW images and you'll figure it out.