A curious effect - "spurious resolution" in an out-of-focus image

Tom Axford

Forum Pro
Messages
11,597
Solutions
57
Reaction score
13,493
Location
Midlands, UK
I came across this quite recently while reading more about lens resolution in response to several other threads on this subject. The effect is apparently well-known to experts in lens optics, but I hadn't seen it before and thought it may be of interest to other readers of this forum.

It is totally counter-intuitive (to me, anyway), but easily demonstrated. Consider the "Siemens star" test object:

8f5327804dc243f8b20ca2bd4af2966f.jpg

Now take a photograph of this object (the lens and camera shouldn't matter), but deliberately de-focus the image so that it is blurred:


82a1dac8acab411887700de0a76cbeed.jpg

The curious thing about this image is that as we move towards the centre, the number of line pairs per mm steadily increases, but the contrast of the line pairs decreases to zero, then increases again, then decreases to zero again, and so on! If you enlarge the image to full size, it can be seen that even the closest lines are resolved, yet these lines are much closer together than the size of the blur circle caused by de-focussing the lens.

[Mathematically, I think this is analogous to the "ringing" effect seen in the Fourier transform of any square waveform.]

It demonstrates rather effectively that measuring the resolution of line pairs may not always be a good measure of the resolution with respect to other details in the image (compare the resolution of the closest line pairs to that of the text at the top left which is illegible, despite being larger).
 
I came across this quite recently while reading more about lens resolution in response to several other threads on this subject. The effect is apparently well-known to experts in lens optics, but I hadn't seen it before and thought it may be of interest to other readers of this forum.

It is totally counter-intuitive (to me, anyway), but easily demonstrated. Consider the "Siemens star" test object:

8f5327804dc243f8b20ca2bd4af2966f.jpg

Now take a photograph of this object (the lens and camera shouldn't matter), but deliberately de-focus the image so that it is blurred:

82a1dac8acab411887700de0a76cbeed.jpg

The curious thing about this image is that as we move towards the centre, the number of line pairs per mm steadily increases, but the contrast of the line pairs decreases to zero, then increases again, then decreases to zero again, and so on! If you enlarge the image to full size, it can be seen that even the closest lines are resolved, yet these lines are much closer together than the size of the blur circle caused by de-focussing the lens.

[Mathematically, I think this is analogous to the "ringing" effect seen in the Fourier transform of any square waveform.]

It demonstrates rather effectively that measuring the resolution of line pairs may not always be a good measure of the resolution with respect to other details in the image (compare the resolution of the closest line pairs to that of the text at the top left which is illegible, despite being larger).
One thing that occurs to me is to determine whether or not the image-sensor filter-stack includes a "beam-splitting optical low-pass" ("AA") filter assembly. They have a periodic spatial frequency response [of the form cos(f), where "f" is spatial frequency].

With a low lens-system F-Ratio (where the MTF response resulting from diffraction is not a significant factor in the net, composite MTF), ...

... and with a small sized (effective,optical) photosite-aperture (where the MTF response resulting from that photosite-aperture is not a significant factor in the net, composite MTF) ...

... not much high spatial frequency attenuation would exist that would tend to "mask" (so to speak) a periodic spatial frequency (MTF) response of a "beam-splitting optical low-pass" ("AA") filter assembly.

Note that the test target does not vary sinusoidally (with a single spectral line) between light and dark. It varies with an abrupt "step", constituting an (optical) "square-wave" having energy at odd multiples of the "fundamental" repetition-frequency (with magnitudes decreasing in proportion to the associated odd-harmonic number).

My thought is that it (might, possibly ?) be non-linear aliasing taking place as a result - where all energy existing above the Nyquist spatial frequency sampling limit [and passed by the "beam-splitting optical low-pass" ("AA") filter assembly] will be mapped into a spatial frequency range that exists between the (negative frequency, as well as positive frequency valued) Nyquist spatial frequency.

One (might) presume that the de-focusing of the lens-system itself acts (in effect) as a spatial frequency low-pass filter that might sufficiently "band-limit" the optical "information" that spatially sampled by the image-sensor photosites.

Falk Lumo calculates that the effects of lens-system de-focus on the net, composite spatial frequency (MTF) response is a symmetrical one around the Nyquist frequency, with the resulting spatial frequency response rising between the Nyquist spatial frequency and the spatial sampling frequency:

DefocusMTFexact_21.gif


Source: http://www.falklumo.com/lumolabs/articles/sharpness/images/DefocusMTFexact_21.gif

From Section 2.3 (Defocus), Figure 11: http://www.falklumo.com/lumolabs/articles/sharpness/

PDF version here: http://www.falklumo.com/lumolabs/articles/sharpness/ImageSharpness.pdf

.

DM
 
Last edited:
DM,

This has nothing to do with the AA filter or the Nyquist frequency of the sensor because the blur circle is very much greater than the pixel spacing. I'm not trying to measure lens resolution or sensor resolution.

Instead, I deliberately de-focussed the image by a substantial amount to produce a blur circle that is of the order of 30 pixels diameter on the sensor. I am purely looking at the effect of this type of blurring on the image of line pairs that continuously change in their spacing.

The line pairs are black and white, but the theoretically computed modulation transfer function for sinusoidal line pairs shows very similar behaviour (see p.15 of the paper by HH Nasse on "How to Read MTF Curves" ), so I don't think the fact that the line pairs are a square wave (in intensity v. position) produces any substantial difference from a sine wave in the analysis.

I think what is important is that the blur circle of a point source (produced when the lens is deliberately de-focussed) is approximately uniform intensity everywhere within the blur circle and then drops to zero intensity outside the blur circle.

Tom.
 
DM,

This has nothing to do with the AA filter or the Nyquist frequency of the sensor because the blur circle is very much greater than the pixel spacing. I'm not trying to measure lens resolution or sensor resolution.

Instead, I deliberately de-focussed the image by a substantial amount to produce a blur circle that is of the order of 30 pixels diameter on the sensor. I am purely looking at the effect of this type of blurring on the image of line pairs that continuously change in their spacing.

The line pairs are black and white, but the theoretically computed modulation transfer function for sinusoidal line pairs shows very similar behaviour (see p.15 of the paper by HH Nasse on "How to Read MTF Curves" ), so I don't think the fact that the line pairs are a square wave (in intensity v. position) produces any substantial difference from a sine wave in the analysis.
.
I think what is important is that the blur circle of a point source (produced when the lens is deliberately de-focussed) is approximately uniform intensity everywhere within the blur circle and then drops to zero intensity outside the blur circle.
So, does that characteristic seem to explain to you what it is that I, too, am able to see at 100% view ?
Yes, the theory (from Nasse's paper and elsewhere) seems to match what my image shows. I was a little surprised that the practice does seem to match the theory so clearly. Not that I have any doubts about the theory, which has been pretty well understood for a very long time, but I hadn't ever noticed this effect before (or, perhaps, I hadn't realised what was happening when I saw it).
 
If you bash it around in Photoshop it is easier to see the phase changes.

77bafde4f4ad4e1ca1993c895ea29a08.jpg.gif
Very good! Increasing the contrast does make it more obvious. And it also makes more obvious that spurious resolution of very closely-spaced line pairs occurs when much larger text is completely illegible.
 
DM,

This has nothing to do with the AA filter or the Nyquist frequency of the sensor because the blur circle is very much greater than the pixel spacing. I'm not trying to measure lens resolution or sensor resolution.

Instead, I deliberately de-focussed the image by a substantial amount to produce a blur circle that is of the order of 30 pixels diameter on the sensor. I am purely looking at the effect of this type of blurring on the image of line pairs that continuously change in their spacing.

The line pairs are black and white, but the theoretically computed modulation transfer function for sinusoidal line pairs shows very similar behaviour (see p.15 of the paper by HH Nasse on "How to Read MTF Curves" ), so I don't think the fact that the line pairs are a square wave (in intensity v. position) produces any substantial difference from a sine wave in the analysis.
.
I think what is important is that the blur circle of a point source (produced when the lens is deliberately de-focussed) is approximately uniform intensity everywhere within the blur circle and then drops to zero intensity outside the blur circle.
So, does that characteristic seem to explain to you what it is that I, too, am able to see at 100% view ?
Yes, the theory (from Nasse's paper and elsewhere) seems to match what my image shows.
It's not clear to me how/where (the text around your referenced p 15) speaks of what you wrote above.
I was a little surprised that the practice does seem to match the theory so clearly. Not that I have any doubts about the theory, which has been pretty well understood for a very long time, but I hadn't ever noticed this effect before (or, perhaps, I hadn't realised what was happening when I saw it).
Looked at your referenced Page 15. It is not clear (to me) from the text what the mechanism might be:

The term ‘spurious resolution’ is intended to express that the isolated measurement of a high resolution at a single, coincidentally favorable spatial frequency can simulate an image quality which is not even present.

.


Do you have any other link-able references that delve more into what is going on with that MTF null ?

.

This section. seems to report that "spurious resolution" did (or does) not occur with sinusoidal variations ?

Have you perchance happened upon this thread ? Interesting thing about behavior when changing focus:

http://forum.photozone.de/index.php...is-optical-phenomenon-donut-shaped-focusblur/
 
Last edited:
It's not clear to me how/where (the text around your referenced p 15) speaks of what you wrote above.
The three graphs at the top of p.15 show (left to right) the point spread function, the resultant edge profile (not relevant to our discussion) and the resultant modulation transfer function, which shows a zero at 40 lp/mm. He also mentions in the text that another zero occurs at 80 lp/mm. I have seen a similar MTF elsewhere that showed several zeros, with peaks of decreasing amplitude between the zeros. Unfortunately, it gave even less explanation!

Although Nasse doesn't explicitly say so, I think it is implicit that his MTF is mathematically computed from the point spread function (in accordance with optical theory).
I was a little surprised that the practice does seem to match the theory so clearly. Not that I have any doubts about the theory, which has been pretty well understood for a very long time, but I hadn't ever noticed this effect before (or, perhaps, I hadn't realised what was happening when I saw it).
Looked at your referenced Page 15. It is not clear (to me) from the text what the mechanism might be:

The term ‘spurious resolution’ is intended to express that the isolated measurement of a high resolution at a single, coincidentally favorable spatial frequency can simulate an image quality which is not even present.

Do you have any other link-able references that delve more into what is going on with that MTF null ?
Unfortunately, I have found no better references.

I am interpreting the term "spurious resolution" as meaning that although 40 lp/mm are not resolved at all, if you go to 60 lp/mm, they are resolved reasonably clearly, and then again there is no resolution at 80 lp/mm, but at 100 lp/mm they can reasonably easily be resolved!

I saw this graph of the MTF (corresponding to a point spread function which is flat until a sharp drop-off to zero) and wondered if I could see this change in resolution of line pairs in practice. An easy way to obtain a point spread function that is approximately flat with a sharp drop-off is to de-focus the lens.
 
.

This section. seems to report that "spurious resolution" did (or does) not occur with sinusoidal variations ?

Have you perchance happened upon this thread ? Interesting thing about behavior when changing focus:

http://forum.photozone.de/index.php...is-optical-phenomenon-donut-shaped-focusblur/
The last link you gave seems to be talking about the same thing, but I think Nasse's paper is very much clearer.

The previous link also discusses the same point, but I am very sceptical about their claim that it doesn't occur with sinusoidal line pairs! I am much more inclined to believe Nasse and he does quite explicitly say earlier in his paper that his MTFs are defined for sinusoidal line pairs. Besides, I have seen similar spurious resolution MTF curves given elsewhere, although not with any detailed discussion of this particular point.
 
.

This section. seems to report that "spurious resolution" did (or does) not occur with sinusoidal variations ?

Have you perchance happened upon this thread ? Interesting thing about behavior when changing focus:

http://forum.photozone.de/index.php...is-optical-phenomenon-donut-shaped-focusblur/
The last link you gave seems to be talking about the same thing, but I think Nasse's paper is very much clearer.
Geez. They don't give us much as to causative mechanism(s).
The previous link also discusses the same point, but I am very sceptical about their claim that it doesn't occur with sinusoidal line pairs!
Yes, other than making that assertion, that linked-to text seemed like a kind of goofy jumble of dis-connected factoids ...
I am much more inclined to believe Nasse and he does quite explicitly say earlier in his paper that his MTFs are defined for sinusoidal line pairs.
OK. Didn't do more than look a page "fore/aft" of your referenced page 15.
Besides, I have seen similar spurious resolution MTF curves given elsewhere, although not with any detailed discussion of this particular point.
Well, you describe a (near) uniform intensity with a relatively abrupt drop-off around the perimeter (not far off a "box-car" function ?). In this illustration they seem to plot a (normalized) "sinc" function (the null locations of which just by happenstance to exist fairly closely numerically to Nasee's null locations.

If the lens-system diffraction extinction spatial frequency were to be significantly higher, then the composite MTF would more-so reflect the "sinc" function associated with a ("box-car" shaped) COC:

Source: http://photo.net/learn/optics/lensTutorialFigures/MTF.gif

Source: http://photo.net/learn/optics/lensTutorialFigures/MTF.gif

(Maybe, if your specific conditions were similar to what I describe above), one might possibly expect such nulls to appear in the MTF response (with positive-valued decreasing in magnitude peaks in between).

Having perused that photo.net tutorial previously a few times, I have never quite understood the bit about de-focusing being involved necessitating an integration in the spatial frequency domain, though:

For the case where there is a combination of diffraction and focus error (resulting in a circle of confusion of diamter ), the OTF is given by the following formula, which involves an integration that must be done numerically.
 
Last edited:
Well, you describe a (near) uniform intensity with a relatively abrupt drop-off around the perimeter (not far off a "box-car" function ?). In this illustration they seem to plot a (normalized) "sinc" function (the null locations of which just by happenstance to exist fairly closely numerically to Nasee's null locations.
I think their curve corresponds to Nasse's because they are both taking about the same size CoC (0.03mm in the former case and about the same for Nasse, although it is hard to read off an accurate value from his point spread function graph).
If the lens-system diffraction extinction spatial frequency were to be significantly higher, then the composite MTF would more-so reflect the "sinc" function associated with a ("box-car" shaped) COC:

Source: http://photo.net/learn/optics/lensTutorialFigures/MTF.gif

Source: http://photo.net/learn/optics/lensTutorialFigures/MTF.gif

(Maybe, if your specific conditions were similar to what I describe above), one might possibly expect such nulls to appear in the MTF response (with positive-valued decreasing in magnitude peaks in between).

Having perused that photo.net tutorial previously a few times, I have never quite understood the bit about de-focusing being involved necessitating an integration in the spatial frequency domain, though:

For the case where there is a combination of diffraction and focus error (resulting in a circle of confusion of diamter ), the OTF is given by the following formula, which involves an integration that must be done numerically.
I think the integration is a fundamental part of the general mathematical formula that relates any MTF and PSF (point spread function), which is technically a Fourier transform. Please don't ask me to discuss Fourier transforms - I used to know the mathematics, but that part of my brain has rusted away!

The fact that he says "focus error" implies to me that he is considering a rectangular (or "box-car") intensity curve for the PSF and so it is effectively the same case as Nasse considers at the top of p.15 of his paper.
 
The curious thing about this image is that as we move towards the centre, the number of line pairs per mm steadily increases, but the contrast of the line pairs decreases to zero, then increases again, then decreases to zero again, and so on!
That happens all the time with heavy aliasing; you see it in resolution test charts. This, of course, is not aliasing. You are looking at the bokeh of the lens as a point spread function, and in that context, it makes more sense because "edgy" bokeh can create fairly fine "details" where you would expect smooth blur.

Did you try alternating red, green, blue instead of white, to separate the effect from individual lines? Or have isolated groups of 1 white line, 2, 3, etc? These things may help intuit what is going on.
 
The curious thing about this image is that as we move towards the centre, the number of line pairs per mm steadily increases, but the contrast of the line pairs decreases to zero, then increases again, then decreases to zero again, and so on!
Hi Tom,

Good show. We normally produce MTF curves as the magnitude (i.e. the absolute value) of the Fourier Transform of a Point Spread Function: they can never go below zero. In any case in a well focused lens captured with good technique the curve decreases monotonically from DC and reaches zero magnitude only once somewhere before 1/(lambdaN).

But in a heavily defocused lens the fourier transform of the psf can actually go negative and oscillate around zero a few times before extinction. The zeros are the gray (zero contrast) areas you see. The negative parts are phase shifts all the way to 180 degrees, where white becomes black and vice versa - as can be clearly seen in David's enhanced version. Of course an MTF curve will only show the absolute value, so it will always looks positive like so:

Green curve is measured MTF, black curve is modeled for a defocus of 1.3 lambda.
It demonstrates rather effectively that measuring the resolution of line pairs may not always be a good measure of the resolution with respect to other details in the image (compare the resolution of the closest line pairs to that of the text at the top left which is illegible, despite being larger).
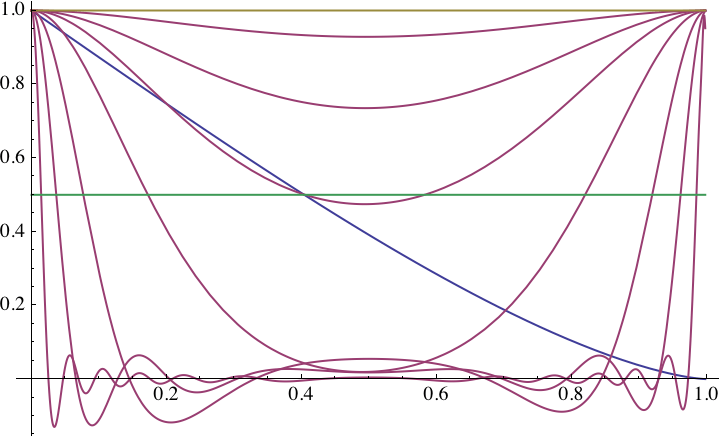
Now you are being unfair: the MTF readings only tell you what linear spatial frequencies are or are not there. If the image is heavily defocused, that's what they show. And if it is while you are trying to measure the linear spatial resolution capabilities of a lens, you are doing something wrong :-)

Jack
 
Last edited:
It demonstrates rather effectively that measuring the resolution of line pairs may not always be a good measure of the resolution with respect to other details in the image (compare the resolution of the closest line pairs to that of the text at the top left which is illegible, despite being larger).
Now you are being unfair: the MTF readings only tell you what linear spatial frequencies are or are not there. If the image is heavily defocused, that's what they show. And if it is while you are trying to measure the linear spatial resolution capabilities of a lens, you are doing something wrong :-)
Thanks, Jack. Point taken. It's only going to behave like that if the PSF is like that obtained by heavy defocusing; i.e. uniform intensity everywhere in the blur circle with a sharp cutoff at the edge of the blur circle.

Just speculating, but I wonder if some modern lenses behave a bit like that even at their best focus. I get the impression that with some lenses with several moulded surfaces, the shape of the PSF or MTF is affected quite a lot by irregularities in the moulded surfaces. The manufacturers often publish MTFs for their lenses, but I presume these are MTFs computed from the lens design rather than from an actual lens with all its imperfections. It would be interesting to know how the MTF and PSF differ for a real lens in comparison with the lens design.

What provoked this speculation was the characteristics of one of my lenses which performs much less well than the published MTF curves would suggest and has the unusual characteristic that the resolution (measured very subjectively, I admit) appears to remain much the same at all apertures from f/1.7 (fully open) down to f/11 (equiv. to f/22 on FF) where diffraction takes over. I'm not sure of the mechanism that could account for that behaviour.

Tom.
 
It demonstrates rather effectively that measuring the resolution of line pairs may not always be a good measure of the resolution with respect to other details in the image (compare the resolution of the closest line pairs to that of the text at the top left which is illegible, despite being larger).
Which is why I do not like visual interpretation of alternating lines (bars) such as USAF1951 chart and Siemens stars. On the other hand, there is nothing fundamentally incorrect with expressing linear resolution as line pairs per mm.

As Jack has shown below, a slanted edge analysis can reliably detect this spurious resolution if you look at the full MTF curve. The oversampling built into the slanted edge method allows us to reliably measure beyond the Nyquist limit implied by the photosite pitch --- provided you recognise that the slanted edge method is a "bulk" resolution measurement, which does not account for perceptual effects like per-pixel noise causing the image to look "more detailed" to our eyes.
 
Tom Axford wrote: ... I wonder if some modern lenses behave a bit like that even at their best focus.
None that I have seen, Tom. And if they did their MTFs would hit zero at some point. This is what the typical MTF chart of an in-focus image captured with decent technique looks like, courtesy of MTF Mapper:

No zeros. From edges in center of relative DPR studio scene raw file, see settings there
I get the impression that with some lenses with several moulded surfaces, the shape of the PSF or MTF is affected quite a lot by irregularities in the moulded surfaces. The manufacturers often publish MTFs for their lenses, but I presume these are MTFs computed from the lens design rather than from an actual lens with all its imperfections. It would be interesting to know how the MTF and PSF differ for a real lens in comparison with the lens design.
Feast your eyes on MTF Mapper by Frans van den Bergh (yes, the very same Frans who is contributing to this thread): you can download it, print one of its excellent charts and start measuring your own MTFs, LSFs and ESFs throughout the field of view.
What provoked this speculation was the characteristics of one of my lenses which performs much less well than the published MTF curves would suggest and has the unusual characteristic that the resolution (measured very subjectively, I admit) appears to remain much the same at all apertures from f/1.7 (fully open) down to f/11 (equiv. to f/22 on FF) where diffraction takes over. I'm not sure of the mechanism that could account for that behaviour.
Before accusing the lens one would need to make sure that the images have been captured with good technique and are in-focus.

Good technique means stable location, oversized tripod and head, delayed release, mirror up, electronic front curtain if available, Manual Exposure and ISO, Manual Focus, VR off, NR off, 14-bit Raw, proper, properly illuminated subject at least 30+ times the focal length away, manual blind focus peaking (with live view a distant second choice), base ISO, stay away from the 1/10s to 1/500s shutter speed range, ETTR. More here .

Then let MTF mapper loose on the images. Let us know.

Jack
 
Last edited:
Not sure if this is a very old discussion. But if the rings are not completely circular but small arcs, would this be indicative of field curvature of the lens.

I refer to this :

https://blog.kasson.com/lens-screening-testing/examples/confusing-15mm-ff-lens/

In the testing of two lens is an area of what is referred to as a 'band of unsharpness'.

I have found the same on my testing of a Sony 24-105 f4 fe lens. As the focus was supposed to be exactly on the Siemens star. I did wonder what had caused the effect , such as field curvature, or ?

I also refer to the lens rentals testing of the lens.

https://www.lensrentals.com/blog/2018/02/mtf-tests-of-the-sony-fe-24-105mm-f4-oss/

I am clueless and hope somebody can explain.

--
Sony A7 & A7r 3 with 24-105 and 16-35
https://www.flickr.com/photos/canterbury/
 
Last edited:
Not sure if this is a very old discussion. But if the rings are not completely circular but small arcs, would this be indicative of field curvature of the lens.
Or astigmatism, if you are referring to the top left corner shot in Jim's first set.
I refer to this :

https://blog.kasson.com/lens-screening-testing/examples/confusing-15mm-ff-lens/

In the testing of two lens is an area of what is referred to as a 'band of unsharpness'.
I have found the same on my testing of a Sony 24-105 f4 fe lens. As the focus was supposed to be exactly on the Siemens star. I did wonder what had caused the effect , such as field curvature, or ?

I also refer to the lens rentals testing of the lens.

https://www.lensrentals.com/blog/2018/02/mtf-tests-of-the-sony-fe-24-105mm-f4-oss/

I am clueless and hope somebody can explain.
That depends. Did you use Jim's protocol, and position the star in the corner of the lens? In that case, you could also be looking at astigmatism. Field curvature should not be an issue if you focused after positioning the star in the corner. (But how does one determine when an image is "properly focused" when it exhibits such extreme astigmatism?)
 

Keyboard shortcuts

Back
Top