Yes, Sony now has the #1 market share for mirrorless in Japan.Saw a thread here a few days back re mirrorless camera sales last year, showing drops in growth for Fuji and m/43 makers like Olympus, and an increase in Sony E sales.
A little *too* eager IMHO (borderline un-ethical?) Certainly something I'll definitely keep in mind when reading reviews of Olympus gear.If you look at the DPR news section and see the OMD-5II hands on review, Oly junketed eight reviewers to Bermuda just to put their new camera through its paces. They seem quite anxious to reverse the negative 2014 sales results with their current champion body.
I don't believe there are any current plans to release f2.8s. But if the market demand is there, certainly they will come!Lots of reviewers always point out how much they love the Sony E cameras, but add that these are only let down by the lens lineup.
Given this, am just wondering when Sony will intro their standard and tele 2.8 zooms similar to what Fuji and others now offer. I think when they do this, Sony E especially at its present price points becomes a mirrorless juggernaut.
I had the 'F2.8 / F4' discussion with a Sony rep. a while back, and his take was that with the current sensor technology F2.8 isn't required (as it once was) to obtain high shutter speeds (with current ISO performance the ISO can be pushed instead). A top photojournalist who was in on the discussion agreed.
Depth of Field is of course greater, but the often marginal difference there is thought to be a worth-while trade-off for the reduced size, weight, cost (and sometimes sharpness) offered by the F4
Why do you think Sony has delayed? Could it have something to do with a debate on whether to put IBIS in all future new E bodies just like the A7II, thus no more need for OSS lenses? Or is it something as banal as a lack of capability. Certainly, the non-intro of new lenses at the CISS shows there's a crimp somewhere in the new lens pipeline.
Don't get me wrong, am fully invested in Sony E and hope it succeeds even more. Just wondering, is all.
Reading mode:
Install the app
How to install the app on iOS
Follow along with the video below to see how to install our site as a web app on your home screen.
Note: This feature may not be available in some browsers.
-
Welcome to the new forums! Please read this first. For known issues we are working to resolve, click here.
You are using an out of date browser. It may not display this or other websites correctly.
You should upgrade or use an alternative browser.
You should upgrade or use an alternative browser.
Sony E camera + 2.8 zooms = big blow vs other mirrorless. So why none yet?
- Thread starter westlites
- Start date
westlites
Leading Member
True.Well about the primes. In the E-mount system there is the 35mm f1.4 prime lens comming soon and an other fast prime next year. I can hear the people here complain about the size allready..I myself bought the A6k due to size and weight. But it's not just about the camera, it's also the E mount system. It's not too much to ask that the system include lenses like 2.8 zooms, or even telephotos longer than 200 mm and primes faster than 1.8.The problem is the Size and weight. Many buy the A6000 for compactness and low weight. The Fuji 16-55mm f/2.8 weights more then the A6000 with the 16-70 f/4 Zeiss lens. Many people will not buy that lens for that reason alone! But Yes you are right, some peopel will buy it, but it will be a smaller % then Nikon people (who have larger DSLRs so the size is not that important) and a smaller % of a smaller number of units means a very small number of people are willing to pay over $1000 so it will be very hard to make a profit with these lenses just now.
Sony E's success has affected Sony A most of all, I would think. Presence of a good lens lineup doesn't guarantee a system's success of course, but it definitely helps.Not realy true, look at the DSLR/DSLT line, it has all the lenses most people want, but sales are not that great, compared to Canon and Nikon. The same goes for Pentax, a good lens lineup, but no great sales at all....Having a more complete system will mean more sales for Sony, addressing your economies of scale objection for them to produce such.
Wouldn't be surprised if Nikon is developing its own APS-C and FF mirrorless cameras. If that happens, Sony would do well to have its complete lens lineup ready by then.When you cambine all mirrorless camera brands together, they sell way less then Nikon does with their DSLRs.
Did you notice that the A7II is just a 150 grams lighter than the D750? If the upsizing trend continues for Sony E at least for FF, don't think having smaller and lighter lenses would be as important as having great IQ lenses that match up with Nikon and Canon offerings.Accept it, Large and heavy lenses will not be very populair on mirrorless, so there will be just a few, and they will be expensiveBut I would not carry the standard 2.8 zoom all day, it would be be only for when I need it. I would use primes, 18-105 4.0, or even the current 16-50 for all-day carry.I can have an A6000 with a 16-70mm f/4 Zeiss lens that weights 652 grams or a Fuji X-A1 with the 16-55mm f/2.8 lens that weights 985 grams.Re weight/bulk, A6k with 2.8 zoom would still be lighter/less bulky than DSLR with same A6k capability and 2.8 zoom.
The Sony system will be cheaper, have an EVF and gives me 25mm extra tele reach. What camera do I like to cary with me all day?
I have an LA-EA2 and A mount lenses, it is very useable but a crippling of the A6k's great AF.It would be very nice. You can adapt that lens with the LA-EA2/4 adapter and have all the fun for a low price you know?But who knows, if Sony does produce an E standard 2.8 zoom as light as Tamron's 17-50 2.8, that would be great for all-day carry.
Samsung has just started getting serious, and Fuji still has excellent products and could get its second wind, Sony shouldn't be complacent.Yes and they are just proofing my point! Look where the sales of Panasonic, Olympus and Samsung are, compared to Sony. Just to help you, Sony is number one with more then 34% of the market, Olympus is second (with over 22% of the market) and Panasonic is third (with not more then less then 12% of the market. Fuji, Samsung, are even lower then that. So yes people are realy buying into the system that has a f/2.8 zoom lens....Well, maybe you know something that both Fuji and Samsung don't regarding the business sense of having 2.8 zooms in a crop mirrorless system. Apparently, they don't agree with you because they are offering such lenses.No I say that good and fast lenses are expensive, it is the same with everything. When you want a good and fast car it is more expensive then a car that is less good and is slower... It is a fact. Yes I would like Sony to make a f/2.8 zoom lens, and I would not buy it, but I can unsderstands why Sony is concentrating on other lenses at the moment.Ok, so you say it's the same deal everywhere, that people are charged exorbitant sums for lenses. Same here in Sony E world, but no 2.8 zooms like elsewhere.But again, look at the other brands, even the f/2.8 zoom lenses for the m43 are not cheap, and they should be a lot cheaper then the APS lenses from Fuji and Samsung, as they can share them on two brands with a large number o users. But what do you see? Expensive lenses, large lenses and not that much buyersSuch a zoom can be used w.o. gaining low DOF and/or lower noise; or you can stop it down to f4 and probably already reach or exceed current (good) zoom lens IQ.
They should, but first they should make those lenses that people realy buy...It wouldn't surprise me that less people buy the 2.8 zooms, doesn't mean Sony shouldn't offer them, too.
thoth22
Forum Enthusiast
I owned a Tamron 17-50mm f/2.8 lens, it wasn't huge at all. It was pretty light, it was sharp, had decent bokeh, not a bunch of CA. Why do the f/2.8 lenses have to be huge and cost thousands of dollars? The Tamron sells for $499. You can compare its sharpness on the-digital-picture with Canon's 17-55mm. It competes and betters it at some focal lengths and doesn't cost an arm and a leg. I know it's not a zeiss or L series lens but surely Sony could manufacture something similar, at a similar price point, and it would sell. The point is, apparently Sony prefers to spend their time and money elsewhere, but as Tamron shows, a not large constant f/2.8 lens can be made.
had the Sigma 1850 2.8 on Canon 350, great IQ too.
And to those promoting the usage of these lenses via LEA adapter: You forget, no OSS since A-mount bodies have IBIS, e-mount don't. Makes the gain in light worthless for lowlight.
And to those promoting the usage of these lenses via LEA adapter: You forget, no OSS since A-mount bodies have IBIS, e-mount don't. Makes the gain in light worthless for lowlight.
thoth22
Forum Enthusiast
Tamron f/2.8 17-50mm lens is not very big nor heavy nor expensive ($499). It's not the best but competes against Canon's 17-55mm in sharpness and CA at some, not all, focal lengths.
I owned a Tamron 17-50mm f/2.8 lens, it wasn't huge at all. It was pretty light, it was sharp, had decent bokeh, not a bunch of CA. Why do the f/2.8 lenses have to be huge and cost thousands of dollars? The Tamron sells for $499. You can compare its sharpness on the-digital-picture with Canon's 17-55mm. It competes and betters it at some focal lengths and doesn't cost an arm and a leg. I know it's not a zeiss or L series lens but surely Sony could manufacture something similar, at a similar price point, and it would sell. The point is, apparently Sony prefers to spend their time and money elsewhere, but as Tamron shows, a not large constant f/2.8 lens can be made.
Hans vdC
Senior Member
Hm, not sure I agree. I used the Canon 17-55/2.8 a LOT on my 7D and while bigger than the 16-70Z for example, it's not that far from the 18-105 which a lot of people like (me included).
kape06111
Well-known member
- Messages
- 218
- Reaction score
- 93
Just put your tamron on a A6000 or A7 and you will see why sony is not doing it.I owned a Tamron 17-50mm f/2.8 lens, it wasn't huge at all. It was pretty light, it was sharp, had decent bokeh, not a bunch of CA. Why do the f/2.8 lenses have to be huge and cost thousands of dollars? The Tamron sells for $499. You can compare its sharpness on the-digital-picture with Canon's 17-55mm. It competes and betters it at some focal lengths and doesn't cost an arm and a leg. I know it's not a zeiss or L series lens but surely Sony could manufacture something similar, at a similar price point, and it would sell. The point is, apparently Sony prefers to spend their time and money elsewhere, but as Tamron shows, a not large constant f/2.8 lens can be made.
--
un huh
Last edited:
FingerPainter
Forum Pro
- Messages
- 12,593
- Solutions
- 37
- Reaction score
- 13,643
I'm sure Sony's marketing department is happy to hear you say that, but there's just one slight catch - it simply isn't true.The era of f/2.8 zoom lenses (FF DSLR) is gone. Today's newer generation of sensors can surpass the old f/2.8 adagio by almost a full stop - hence f/4.0 can be the new norm.
dSLRs outsell Sony mirrorless ILCs by more than 10:1. Their era isn't gone yet.
The sensor on the A7 II has no SNR 18% advantage over the D700 (Nikon's first prosumer FF dSR) below ISO 6400. The A7 II does have a DR advantage, but over most of the ISO range that advantage is 1/3 stop, not "almost a full stop".
Yet, strangely enough, as Sony comes out with new mirrorless ILC bodies, Nikon comes out with even more new dSLR bodies, most with Sony sensors in them, being powered by better processors and fed by better lenses. The latest Sony E-mount A7 II might be ahead of the D700 in DR by half a stop averaged over the ISO range, but it is behind the D750 by half a stop over the same range.
Given the 1 stop difference in available lens speeds, Nikon dSLRs are 1.5 stops faster than Sony MILCs. And that makes a difference in several types of shooting.
FingerPainter
Forum Pro
- Messages
- 12,593
- Solutions
- 37
- Reaction score
- 13,643
The most logical time would be in conjunction with a new, higher level body. So if we see an a7000 or an a8, that would be the most likely time to see the introduction of f/2.8 zooms.... am just wondering when Sony will intro their standard and tele 2.8 zooms similar to what Fuji and others now offer. ...
One makes one's place in the market by product differentiation. Mirrorless has several advantages relative to dSLRs (and several disadvantages too). Perhaps the most oft-cited advantage is size and weight. Making only f/4 zooms and keeping them under 300mm focal length is a way to maintain a significant differentiation in that regard.Why do you think Sony has delayed?
Could be corporate uncertainty about the future of Sony cameras, though I hear they are finally making a quarterly profit.Could it have something to do with a debate on whether to put IBIS in all future new E bodies just like the A7II, thus no more need for OSS lenses? Or is it something as banal as a lack of capability. Certainly, the non-intro of new lenses at the CISS shows there's a crimp somewhere in the new lens pipeline.
I can attest to this. I have my Tamron 28-75 f2.8 K-mount on my a6000 and it is simply unwieldy at times.Just put your tamron on a A6000 or A7 and you will see why sony is not doing it.I owned a Tamron 17-50mm f/2.8 lens, it wasn't huge at all. It was pretty light, it was sharp, had decent bokeh, not a bunch of CA. Why do the f/2.8 lenses have to be huge and cost thousands of dollars? The Tamron sells for $499. You can compare its sharpness on the-digital-picture with Canon's 17-55mm. It competes and betters it at some focal lengths and doesn't cost an arm and a leg. I know it's not a zeiss or L series lens but surely Sony could manufacture something similar, at a similar price point, and it would sell. The point is, apparently Sony prefers to spend their time and money elsewhere, but as Tamron shows, a not large constant f/2.8 lens can be made.
--
un huh
As much as I would love an e-mount equivalent for my a6000 -- f2.8 is great for composition -- I readily accept the fact that it'll probably never happen because of various practicalities.
thoth22
Forum Enthusiast
Ah, good point. I write and not think sometimes.
westlites
Leading Member
I owned a Tamron 17-50mm f/2.8 lens, it wasn't huge at all. It was pretty light, it was sharp, had decent bokeh, not a bunch of CA. Why do the f/2.8 lenses have to be huge and cost thousands of dollars? The Tamron sells for $499. You can compare its sharpness on the-digital-picture with Canon's 17-55mm. It competes and betters it at some focal lengths and doesn't cost an arm and a leg. I know it's not a zeiss or L series lens but surely Sony could manufacture something similar, at a similar price point, and it would sell. The point is, apparently Sony prefers to spend their time and money elsewhere, but as Tamron shows, a not large constant f/2.8 lens can be made.
thoth22
Forum Enthusiast
thank you for back up there. I had the 28-75 and used with 5d, didn't give pleasing results. The 17-50 will compete and best 17-55 in several areas, as you can see on a few websites that post that info.
westlites
Leading Member
Thanks for insights, Paint. Makes sense.The most logical time would be in conjunction with a new, higher level body. So if we see an a7000 or an a8, that would be the most likely time to see the introduction of f/2.8 zooms.... am just wondering when Sony will intro their standard and tele 2.8 zooms similar to what Fuji and others now offer. ...
One makes one's place in the market by product differentiation. Mirrorless has several advantages relative to dSLRs (and several disadvantages too). Perhaps the most oft-cited advantage is size and weight. Making only f/4 zooms and keeping them under 300mm focal length is a way to maintain a significant differentiation in that regard.Why do you think Sony has delayed?
Could be corporate uncertainty about the future of Sony cameras, though I hear they are finally making a quarterly profit.Could it have something to do with a debate on whether to put IBIS in all future new E bodies just like the A7II, thus no more need for OSS lenses? Or is it something as banal as a lack of capability. Certainly, the non-intro of new lenses at the CISS shows there's a crimp somewhere in the new lens pipeline.
Re your A7 vs D700 comparison above, how did you arrive at the one-stop difference between Nikkors and Sony lenses ? Lens speeds meaning 2.8 vs 4.0?
FingerPainter
Forum Pro
- Messages
- 12,593
- Solutions
- 37
- Reaction score
- 13,643
Yes.Re your A7 vs D700 comparison above, how did you arrive at the one-stop difference between Nikkors and Sony lenses ? Lens speeds meaning 2.8 vs 4.0?
Digitalis32
Leading Member
Sony isn't doing it because as far as they are concerned: there is no money in it. For them the R&D costs outweigh the gains, so get used to slower lenses. you can always change system and enjoy faster lenses right now.
Sony is an entertainment company, sure they took Minolta(RIP) and look at what they have done with that IP? practically nothing. Minolta(RIP) had a History in photography, Sony has basically nothing going for them in that regard. When Olympus, Fuji, Kodak, Pentax, Canon, Horseman, Sinar, Nikon, Ebony, Minolta, Alpa, Leica, Patrika, Cosina, Konika, Contax, Minox, Voigtlander, Zeiss et al were all slugging it out in the days of film: Sony was busy with...betamax.
Sony is an entertainment company, sure they took Minolta(RIP) and look at what they have done with that IP? practically nothing. Minolta(RIP) had a History in photography, Sony has basically nothing going for them in that regard. When Olympus, Fuji, Kodak, Pentax, Canon, Horseman, Sinar, Nikon, Ebony, Minolta, Alpa, Leica, Patrika, Cosina, Konika, Contax, Minox, Voigtlander, Zeiss et al were all slugging it out in the days of film: Sony was busy with...betamax.
Last edited:
DUSTY LENS
Senior Member
the fuji lenses aren't that big or bulky because they are only an "equivalent aperture of F5.6" on ff.I do have a D700 and much of the Nikkors including the trinity 2.8 zooms.
Instead of getting the D750 I tried out mirrorless and chose the A6000. Am quite happy with it, but do miss 2.8 zooms which are available in the Fuji APC system. The Fuji lenses aren't that big or bulky, esp. when compared to DSLR equivalents.
keep repeating the mantra...
DUSTY LENS
Senior Member
OK , that makes sense . Not the numbers , not the facts , but your post makes complete sense .I doubt F/2.8 zooms would have an effect. Everyone else already has them. More about bragging rights. Have you seen the prices for the Zeiss lenses? Did you know the Sony A-mount non-stabilized F/2.8 70-200mm retails for $2999? While we talk about expensive lenses, their sales are not very high.
Here is the link to the story from SAR
http://www.sonyalpharumors.com/japa...mirrorless-ranking-looses-on-the-dslr-market/
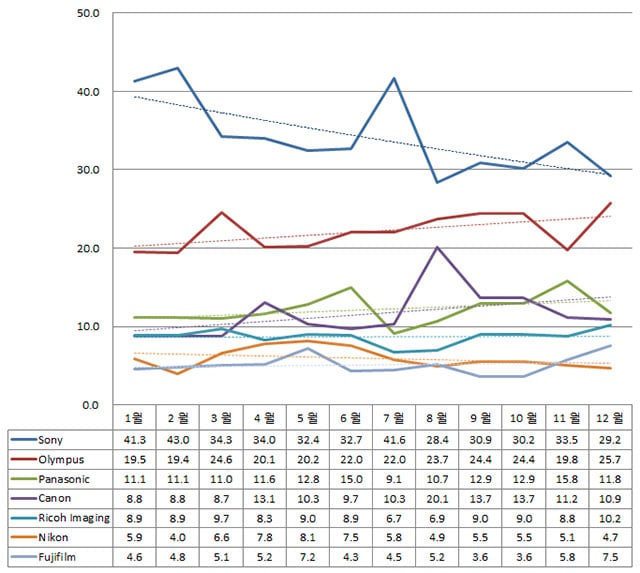
Sony 34.3, Olympus 22.3, Panasonic 11.9 (BCN only gave the top 3)
Petapixel had a more detailed graph for 2014. Both offer stats for all kinds of spin.
Take you pick on the spin you prefer.
- Sony had over 40% of the market in parts of 2014.
- Sony dropped to under 30% of the market in 2014.
- Sony overall had 34.3% of the market in 2014.
- The sales trend for Sony was down in 2014.
- We don't know actual sales so these numbers do not mean much.
- This is only for Japan and not the world so meaningless.
--
Don't worry - be happy!
Thanks for explaining everything ,
Dusty
DUSTY LENS
Senior Member
I enjoy and I even respect your tenacity or abilities to analyze what the information tells us , but I tend to believe it helps a good deal to have a cup of tea then read the tea leaves in the bottom of the cup . But only when you need to rely on the meaning of the data .Sony had in some month (after r3eleasing a new camera) a higher market share. You see the same effect with other cameras.I doubt F/2.8 zooms would have an effect. Everyone else already has them. More about bragging rights. Have you seen the prices for the Zeiss lenses? Did you know the Sony A-mount non-stabilized F/2.8 70-200mm retails for $2999? While we talk about expensive lenses, their sales are not very high.
Here is the link to the story from SAR
http://www.sonyalpharumors.com/japa...mirrorless-ranking-looses-on-the-dslr-market/
Sony 34.3, Olympus 22.3, Panasonic 11.9 (BCN only gave the top 3)
Petapixel had a more detailed graph for 2014. Both offer stats for all kinds of spin.
- Sony had over 40% of the market in parts of 2014.
But when you look at the totals the story is different
- Sony dropped to under 30% of the market in 2014.
Yes that number is what you must look at!
- Sony overall had 34.3% of the market in 2014.
No it is not, it is up for sony! (I explain later)
- The sales trend for Sony was down in 2014.
This only shows how well Sony does compared to others, indeed.
- We don't know actual sales so these numbers do not mean much.
Not totaly meaningless, but yes brands as Samsung are not in this graph
- This is only for Japan and not the world so meaningless.
Why is Sony trend in 2014 not loosing but winning? That has all to do with what you look at.Take you pick on the spin you prefer.
--
Don't worry - be happy!
You look at january as reference month, but is that a realistic month? In that month the new A7 and A7r came to market and people started buying that camera, the A5000 was announced too. You see more sales when this kind of things do happen for all brands.
The only reference that is honnest is the previous year:
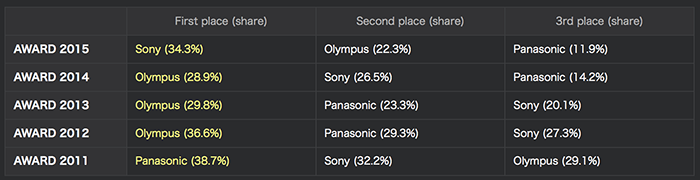
You can see that Sony went up from 26.5 to 34.3% Olympus on the other hand whent down from 28.9 to 22.3%, Panasonic goes down from 14.2 to 11.9% How is that possible? Your graph is indecating the opposit!
As you say, we do not know the numbers of sold cameras in every period. When the number of sold cameras in the month Sony was at its peak where at its peak too, Sony sold way more cameras in the total year then the graph may indicate....
Then there is a reason for the peaks in the graph you show, it can be the release of a new camera, it can be a sale for a camera etc. Whaat your graph clearly shows is that Sony was selling more cameras over the total year then any of the other brands...
Otherwise read the information and enjoy your confusion .
Dusty
Last edited:
Keyboard shortcuts
- f
- Forum
About
Editorial content
Cameras & Lenses
All content, design, and layout are Copyright © 1998–2025 Digital Photography Review All Rights Reserved.
Reproduction in whole or part in any form or medium without specific written permission is prohibited.
When you use DPReview links to buy products, the site may earn a commission.
©GPS Media - Guides, Products, Services.
Reproduction in whole or part in any form or medium without specific written permission is prohibited.
When you use DPReview links to buy products, the site may earn a commission.
©GPS Media - Guides, Products, Services.